
State-level credibility & durability 2026: diverging pathways, policy inertia, and the midterms test
Part of Baringa's Horizons Series
Key takeaway: The US state climate policy landscape is becoming increasingly divided, but frozen in place. Between 2022 and 2024, the country experienced surprising policy convergence as Republican-led states enacted baseline measures and narrowed the gap with traditional leaders. Between 2024 and 2026, that dynamic reversed sharply: Democratic trifectas continued to build policy credibility, albeit modestly, while Republican trifectas rolled back statutory frameworks and divided governments also lost ground.
Looking ahead to 2027, the forward outlook is defined less by divergence and more by inertia. Half of all US states now register a neutral score on durability. As household affordability, energy security, and broader economic concerns take precedence over climate policy, momentum for either progressive expansion or further aggressive rollback has slowed. While the 2026 midterm governor races could reshape policy in a small number of critical balance states, the broader national landscape is settled into distinct, entrenched positions.
At federal level, major actions since January 2025, including emergency orders delaying coal plant retirements, cuts to clean energy tax credits, and the repeal of federal greenhouse gas standards for vehicles and power plants, have left states with few levers beyond the courts. A Democratic House or Senate after the midterms could slow further federal moves through oversight and spending, but reversing them would require the President. With federal direction largely set, differences in decarbonization pathways will come mainly from the states.
From convergence to divergence: the widening partisan credibility divide
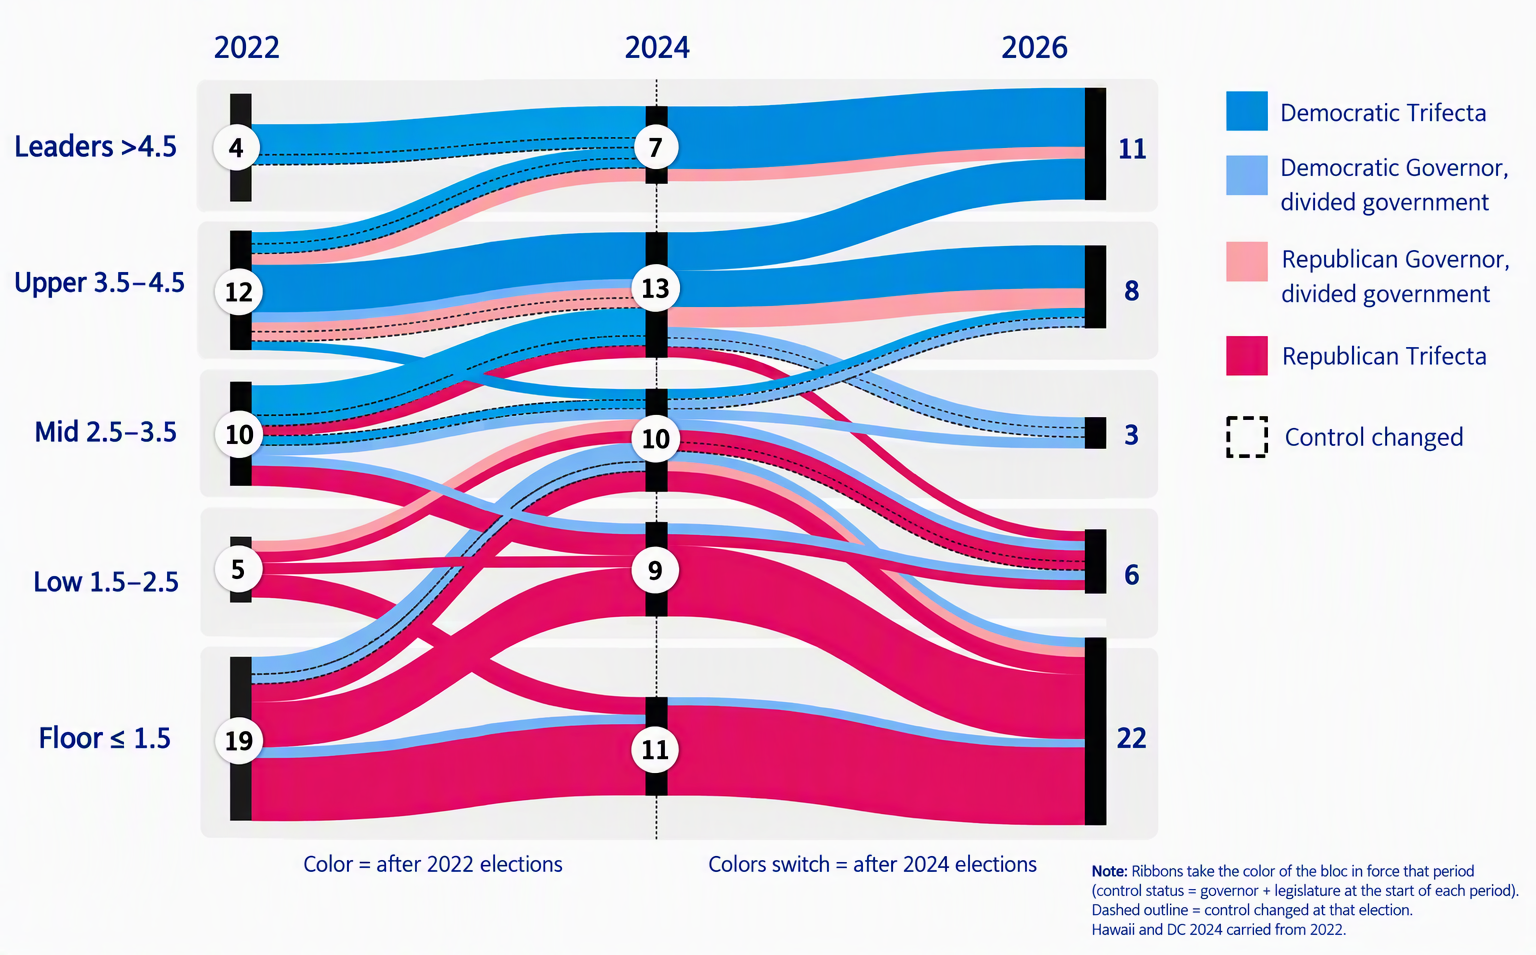
Between 2022 and 2024, state-level decarbonization policy saw notable national convergence. Credibility improved across every political-control group, and Republican-led states, starting from lower baseline scores, recorded the strongest average improvements (+0.55 points in Republican-governor divided states and +0.50 points in Republican trifectas), narrowing the gap with Democratic trifectas (+0.19 points), which remained substantially more credible in absolute terms.
However, between 2024 and 2026, that pattern reversed into sharp structural divergence:
-
Democratic Trifectas continued to strengthen modestly, gaining an average of +0.23 points in policy credibility.
-
Republican Trifectas moved into pronounced rollback, declining by an average of -0.68 points.
-
Divided Governments also moved backwards, with Democratic-governor divided states slipping -0.53 points and Republican-governor divided states falling -0.75 points.
Changes in political control contributed to this divergence but were not the only driver. National political sentiment, notably the “vibe shift” following the election of Trump 2.0 and the cost-of-living crisis, appeared to contribute to the post-2024 change. The widening gap therefore reflects less a renewed surge in Democratic ambition than their relative stability against a broad reversal elsewhere.
Credibility movements across all states 2022-2026
Levers of change: power, emissions & transport prove more elastic than buildings
Baringa assesses state policy credibility across four foundational decarbonization pillars: Emissions decarbonization, Power generation, Transport, and Buildings. The 2024 to 2026 policy movement confirms that divergence is concentrated in specific policy areas rather than occurring evenly across the economy.
- High elasticity (emissions, power and transport): Statutory emissions targets, clean energy mandates and transport requirements appear more sensitive to shifts in political priorities. Across Republican trifectas, the net credibility change was -63 points, driven by emissions (-37 points), power generation (-14 points) and transport (-12 points).
- Comparative stickiness (buildings): Building policies and standards tend to change more gradually. Buildings remained flat across Republican trifectas, compared with significantly larger changes across emissions, power and transport. In Democratic trifectas, buildings were also the largest source of improvement at +9 points.
Policy contrast scorecard: advancing versus rolling back states
The contrast between leading and rolling back states is clearly illustrated by state-level legislative action between 2024 and 2026.
| State | Policy trajectory | 2024 score | 2026 score | Score change | Key legislative catalyst |
| Illinois | Advancing | 4.3 | 4.5 | +0.2 | Statutory net zero by 2050, 100% clean energy by 2050, 2024 IECC with amendments, expanded transport rebate program |
| Delaware | Advancing | 4.3 | 4.8 | +0.5 | 2023 Climate Change Solutions Act, 40% RPS by 2035, ACC II adoption, 2024 IECC-equivalent standards |
| Minnesota | Advancing | 3.5 | 4.0 | +0.5 | Statute 216H.02 net zero by 2050, 100% carbon-free electricity standard by 2040 |
| Montana | Rolling back | 2.5 | 1.3 | -1.2 | HB 971 ban on GHG evaluation for large projects, unreplaced RPS repeal (HB 576) |
| Florida | Rolling back | 4.5 | 1.8 | -2.7 | HB 1645 repeal of 100% renewable goal, no statutory GHG emissions targets |
| North Dakota | Rolling back | 2.3 | 1.3 | -1.0 | SB 2359 removal of renewable objective from state code, voluntary carbon neutrality goal |
The renewable deployment paradox: market fundamentals outrun policy headwinds
While statutory clean energy targets were dismantled across multiple jurisdictions, actual wind and solar project development has demonstrated notable resilience to policy rollback.
Comparing the 14 states where the power generation credibility score fell between 2024 and 2026 due to renewables policy rollbacks (Alaska, Arizona, Florida, Kansas, Massachusetts, Missouri, Montana, North Carolina, Oklahoma, Pennsylvania, Tennessee, Texas, Utah and West Virginia) against states without identified rollbacks, between August 2024 and August 2026:
- Planned capacity expanded faster in rollback states: States with power policy rollbacks recorded a larger increase in planned wind and solar capacity (+26.7% aggregate) than non-rollback states (+22.0% aggregate). Projects continue to be driven by existing pipelines, federal tax-credit safe harboring, technology costs, resource quality, and broader market dynamics.
- Higher project cancelations: While policy rollbacks have not halted deployment, they have coincided with greater development friction. Canceled wind and solar capacity in rollback states rose by +66.4% aggregate, compared to +44.2% aggregate in states without rollbacks. Canceled-project figures may be inflated by recent interconnection reforms.
Policy rollback has not translated into an immediate halt in renewable deployment. Projects continue to be driven by existing pipelines, federal tax-credit safe harboring, technology costs, resource quality and broader market dynamics. However, rollback states also recorded a larger increase in canceled capacity, suggesting deployment volumes would have been higher had state policy support remained, although interconnection reforms may also be a contributing factor.
Data centers & power affordability: support associated with electoral status
State support for data-center development has emerged as a distinct issue where executive attitudes align closely with upcoming electoral timelines and household economic concerns.
Baringa's data-center support index (scored from 1 to 10) highlights clear patterns across political control and electoral proximity:
- Partisan baseline: Republican governors show higher baseline support for data-center development across all electoral categories compared to Democratic governors. The partisan gap is widest among governors not on the ballot and narrowest among outgoing governors.
- The re-election contrast: Governors actively facing re-election on the November 2026 ballot show lower support than those not on the ballot or term-limited:
- Governors running for re-election in 2026: Democratic support averages 3.9 / 10; Republican support averages 5.9 / 10 (overall average: 4.8 / 10).
- Governors not on the ballot in 2026: Democratic support averages 5.3 / 10; Republican support averages 8.5 / 10 (overall average: 7.1 / 10).
- Outgoing / term-limited governors: Democratic support averages 6.8 / 10; Republican support averages 7.8 / 10 (overall average: 7.3 / 10).
Data center durability within each governor race
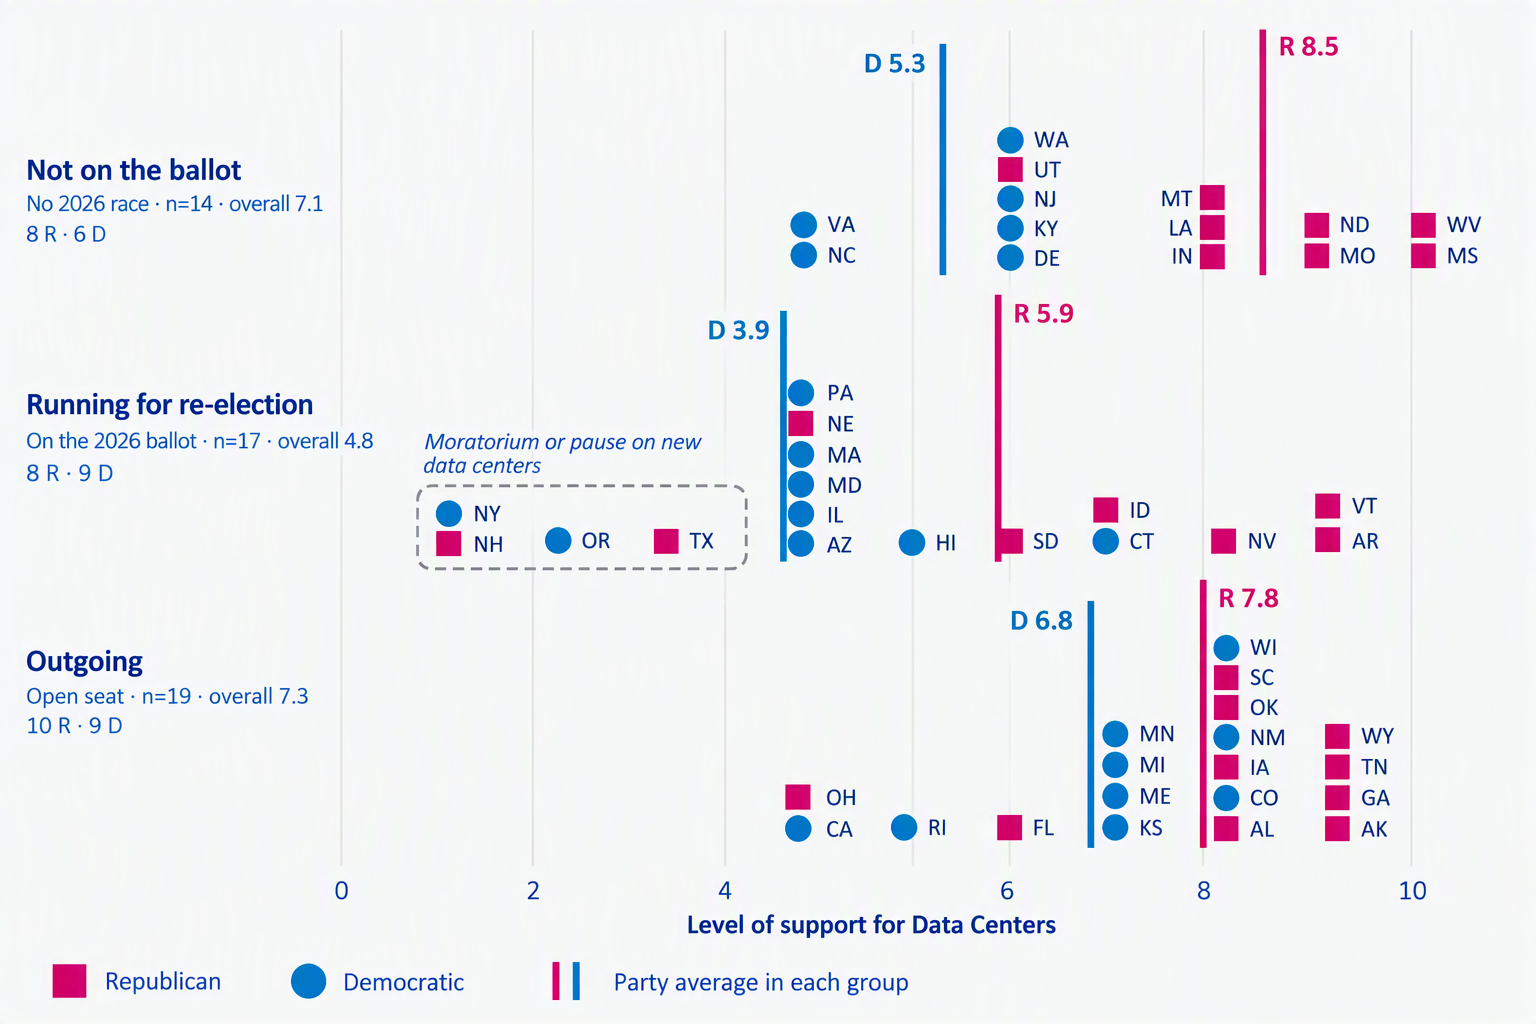
While the data does not establish whether affordability directly explains this pattern or why the contrast is larger among Democrats, household affordability and cost-of-living concerns represent a plausible context for governors balancing capital investments against voter sensitivities over electricity bills and grid stress.
Durability inertia and midterm pivot states: where policy could shift
Looking ahead to 2027, the forward-looking Durability score (measured from -2 (high risk of rollback) to +2 (strong momentum for progress)) indicates widespread inertia. Exactly 25 states (50%) now register a neutral score of 0, compared to 6 states in 2022 and 7 states in 2024. No state scores +2 in 2026, down from eight in 2024.
This shift toward neutrality reflects settling into established positions rather than consensus. Lower-credibility states have already dismantled baseline targets, while higher-credibility states face growing resistance to adding costly new mandates amid affordability concerns. Rising power bills are also slowing progress in Democratic-led states, and none has stepped in to replace federal support withdrawn from offshore wind. Furthermore, state legislative strength acts primarily as an accelerator of existing policy direction rather than an independent creator of ambition.
Durability has also proven informative for credibility: states with stronger 2024 durability scores generally saw more stable or improving credibility between 2024 and 2026, while lower-durability states were more likely to decline. It is not fully deterministic, as outliers such as Alaska and Arizona show, but it indicates a state’s ability to sustain its prevailing policy direction.
With 36 governor seats on the ballot in November 2026 (including 19 open seats and 11 contested races), four potential partisan flips could alter state policy balance. Three of them (Georgia, Iowa and Kansas) are profiled below; the fourth is Alaska.
| State | Current status | Midterm pivot scenario | Policy implications |
| Georgia | Republican trifecta (Credibility: 1.3, Durability: 0) | Keisha Lance Bottoms (D) vs Jackson (R) |
A Democratic win would end Republican unified control, enabling limited executive-led progress on climate and equity. A Jackson win would preserve the Republican trifecta.
|
| Iowa | Republican trifecta (Credibility: 1.3, Durability: +1) | Rob Sand (D) challenging Republican trifecta | Rob Sand’s pragmatic platform suggests progress would focus on priorities such as clean water, rather than a broad climate agenda. |
| Kansas | Divided government (Credibility: 1.5, Durability: -2) | Senate President Ty Masterson (R) seeking open seat | A Ty Masterson win could create a Republican trifecta, increasing downside risk for renewable and clean energy policy. |
Frequently asked questions
How does Baringa evaluate state-level credibility and durability?
- Credibility (Scores 1 to 6): Evaluates the strength and maturity of existing policies across four sectors: emissions targets, power generation mandates, transport policies, and building energy codes.
- Durability (Scores -2 to +2): Evaluates the forward-looking stability of those policies, considering executive intent, legislative majorities, and political momentum.
Why did state climate credibility diverge between 2024 and 2026 after converging previously?
Between 2022 and 2024, credibility converged as Republican trifectas made strong initial gains from low baselines. Between 2024 and 2026, this reversed: Democratic trifectas edged higher (+0.23 average gain) while Republican trifectas moved into rollback (-0.68 average decline) and divided governments also declined, influenced by shifting political control, federal political dynamics, and cost-of-living concerns.
Does policy rollback halt renewable energy deployment?
No. Market fundamentals continue to drive deployment. Between August 2024 and August 2026, planned wind and solar capacity grew by 26.7% (aggregate) in states with power policy rollbacks, compared to 22.0% in non-rollback states. However, rollback states experienced a larger increase in canceled capacity (66.4% versus 44.2%), indicating greater friction, although recent interconnection reforms may inflate cancelations.
How do the 2026 governor elections influence the durability outlook?
Thirty-six governor seats are on the ballot in 2026, with 11 closely contested races. Four states present potential partisan flips: Georgia and Iowa could break unified Republican control, Kansas could establish a new unified Republican trifecta, and Alaska is the fourth.
Our Experts


Related Insights

Horizons Series: Insights for Navigating What's Next
Explore Baringa's Horizons Series for expert analysis on economic shifts, consumer trends, energy markets, and strategic planning
Read more
Global macroeconomic outlook Q3 2026
Understand the key economic forces shaping 2026, from inflation and interest rates to geopolitical risk, growth prospects and sector impacts.
Read more
US consumer spending insights for strategic decision-makers
Baringa's Q2 2026 Consumer Spending Report reveals which US consumers are proving most resilient, which are under the greatest pressure, and where demand is holding up as economic uncertainty continues.
Read moreIs digital and AI delivering what your business needs?
Digital and AI can solve your toughest challenges and elevate your business performance. But success isn’t always straightforward. Where can you unlock opportunity? And what does it take to set the foundation for lasting success?
 Keep up to date
 Our industry insights