Britain’s vulnerable working population in 2022
29 March 2022
Baringa’s Vulnerability Index reveals the most at-risk areas of the UK’s working population
It is vitally important that we understand the parts of the labour market that are exposed to a deteriorating economic environment so that companies and policymakers can target their planning and support to minimise economic distress.
Baringa has created a Vulnerability Index of working people in order to identify likely changes in financial vulnerability across the UK’s working population. Our main findings are:
-
Five million workers are in the highest risk category for increasing vulnerability.
-
Londoners have suffered the greatest increases in their relative level of financial vulnerability.
-
Workers in a quarter of sectors that we analysed have become more financially vulnerable.
-
It’s a rapidly changing situation and therefore important that businesses adopt a proactive approach to face into the challenge.
The importance of understanding in-work vulnerability
The vulnerability of the retired and unemployed is relatively well understood and tracked, but this is not necessarily the case for those in-work, for whom we think about vulnerability as the likelihood of household bills exceeding income.
The Index is a relative measure – it tracks changes in financial vulnerability for different roles and regions, rather than absolute levels; and the changes in vulnerability spanning two years, 2020 and 2021.
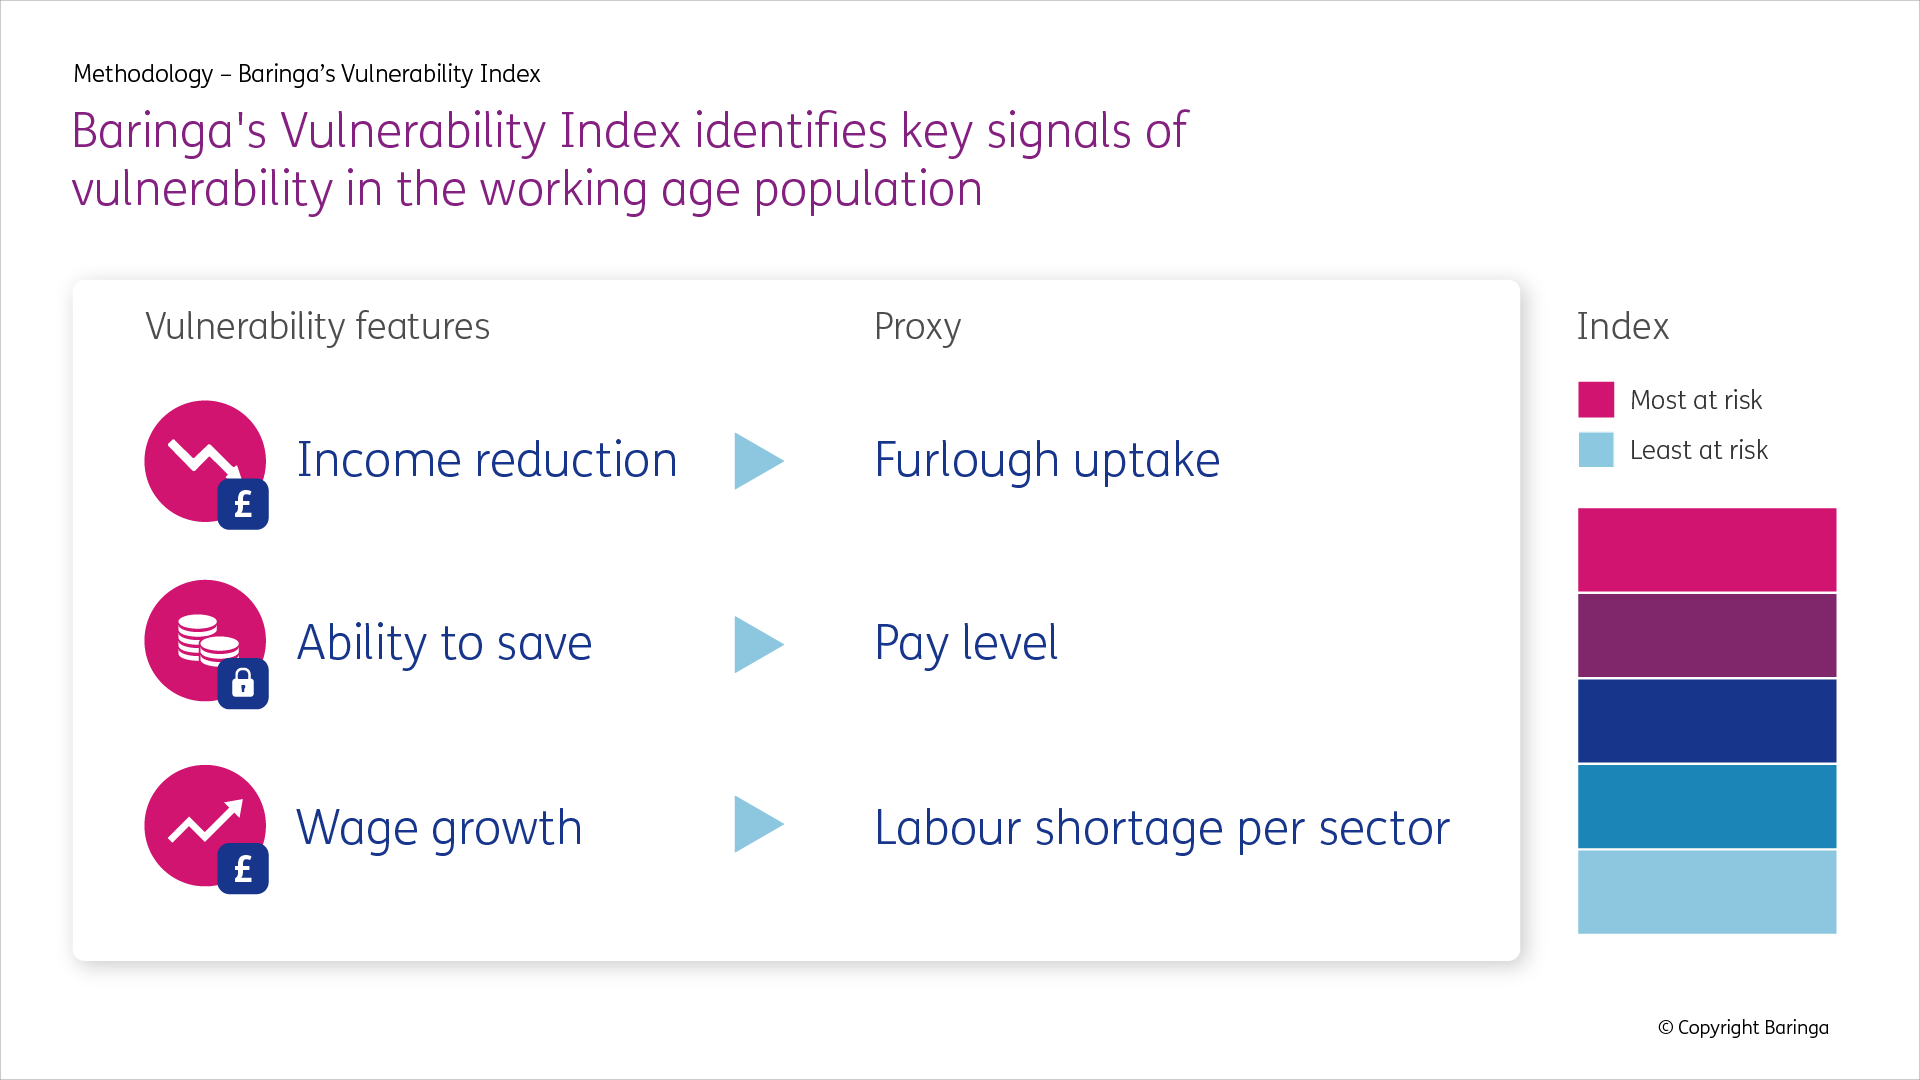
The unprecedented interventions into the economy over the past two years mean that identifying vulnerability cannot rely on historical assumptions. Therefore, Baringa has constructed a new methodology that evaluates financial vulnerabilities according to three variables, as illustrated below.
- The Index uses furlough uptake to approximate the likelihood of different occupations having suffered a significant income reduction.
- It uses median earnings for each occupation type to augment the view on lost earnings with a view on their starting level of savings.
- Finally, it uses labour shortage by sector to judge workers’ pay-bargaining power, and hence their resistance or vulnerability to inflation. This is crucial information in the context of rising costs-of-living.

Interactive map of financial vulnerability across regions/sectors
Hover over a UK region to see the relative change in financial vulnerability of workers in different sectors of the economy.
Rates of potential financial vulnerability growth vary across the UK
The spread of economic sector has caused some regions to experience a greater rise in risk than others
Percentage deviation from UK average of most impacted sectors.
Scotland
Wholesale & retail trade; repair of motor vehicles and motorcycles
-5%
Transport & storage
-18%
Accommodation & food service activities
4%
Real estate activities
-18%
Administrative & support service activities
-11%
Arts, entertainment & recreation
4%
Northern Ireland
Wholesale & retail trade; repair of motor vehicles and motorcycles
11%
Transport & storage
-35%
Accommodation & food service activities
-15%
Real estate activities
-36%
Administrative & support service activities
-39%
Arts, entertainment & recreation
-36%
North East
Wholesale & retail trade; repair of motor vehicles and motorcycles
-5%
Transport & storage
-1%
Accommodation & food service activities
16%
Real estate activities
-25%
Administrative & support service activities
-6%
Arts, entertainment & recreation
-13%
North West
Wholesale & retail trade; repair of motor vehicles and motorcycles
12%
Transport & storage
6%
Accommodation & food service activities
-5%
Real estate activities
-19%
Administrative & support service activities
-6%
Arts, entertainment & recreation
-11%
Yorkshire and The Humber
Wholesale & retail trade; repair of motor vehicles and motorcycles
1%
Transport & storage
1%
Accommodation & food service activities
4-13%
Real estate activities
-8%
Administrative & support service activities
7%
Arts, entertainment & recreation
-9%
East Midlands
Wholesale & retail trade; repair of motor vehicles and motorcycles
9%
Transport & storage
26%
Accommodation & food service activities
-19%
Real estate activities
0%
Administrative & support service activities
-13%
Arts, entertainment & recreation
-22%
West Midlands
Wholesale & retail trade; repair of motor vehicles and motorcycles
-5%
Transport & storage
-18%
Accommodation & food service activities
4%
Real estate activities
-18%
Administrative & support service activities
-11%
Arts, entertainment & recreation
4%
Wales
Wholesale & retail trade; repair of motor vehicles and motorcycles
-3%
Transport & storage
-47%
Accommodation & food service activities
15%
Real estate activities
-12%
Administrative & support service activities
-14%
Arts, entertainment & recreation
-29%
East of England
Wholesale & retail trade; repair of motor vehicles and motorcycles
5%
Transport & storage
7%
Accommodation & food service activities
-5%
Real estate activities
-16%
Administrative & support service activities
13%
Arts, entertainment & recreation
4%
London
Wholesale & retail trade; repair of motor vehicles and motorcycles
-24%
Transport & storage
4%
Accommodation & food service activities
4%
Real estate activities
28%
Administrative & support service activities
8%
Arts, entertainment & recreation
19%
South East
Wholesale & retail trade; repair of motor vehicles and motorcycles
3%
Transport & storage
-14%
Accommodation & food service activities
-2%
Real estate activities
-4%
Administrative & support service activities
-4%
Arts, entertainment & recreation
8%
South West
Wholesale & retail trade; repair of motor vehicles and motorcycles
2%
Transport & storage
-33%
Accommodation & food service activities
18%
Real estate activities
8%
Administrative & support service activities
-9%
Arts, entertainment & recreation
-5%
© Copyright Baringa
London’s growing vulnerability risk suggests a ‘levelling down’
The past two years has seen a reversal to the historic patterns of changing economic fortunes, with Londoners suffering the greatest increases in risk of financial vulnerability.
London’s economy is disproportionately weighted towards the sectors and occupations which show the highest levels of vulnerability risk in Baringa’s Index – notably a strong service base. Even in more resilient sectors, such as manufacturing, London’s furlough take-up was far above the national average.
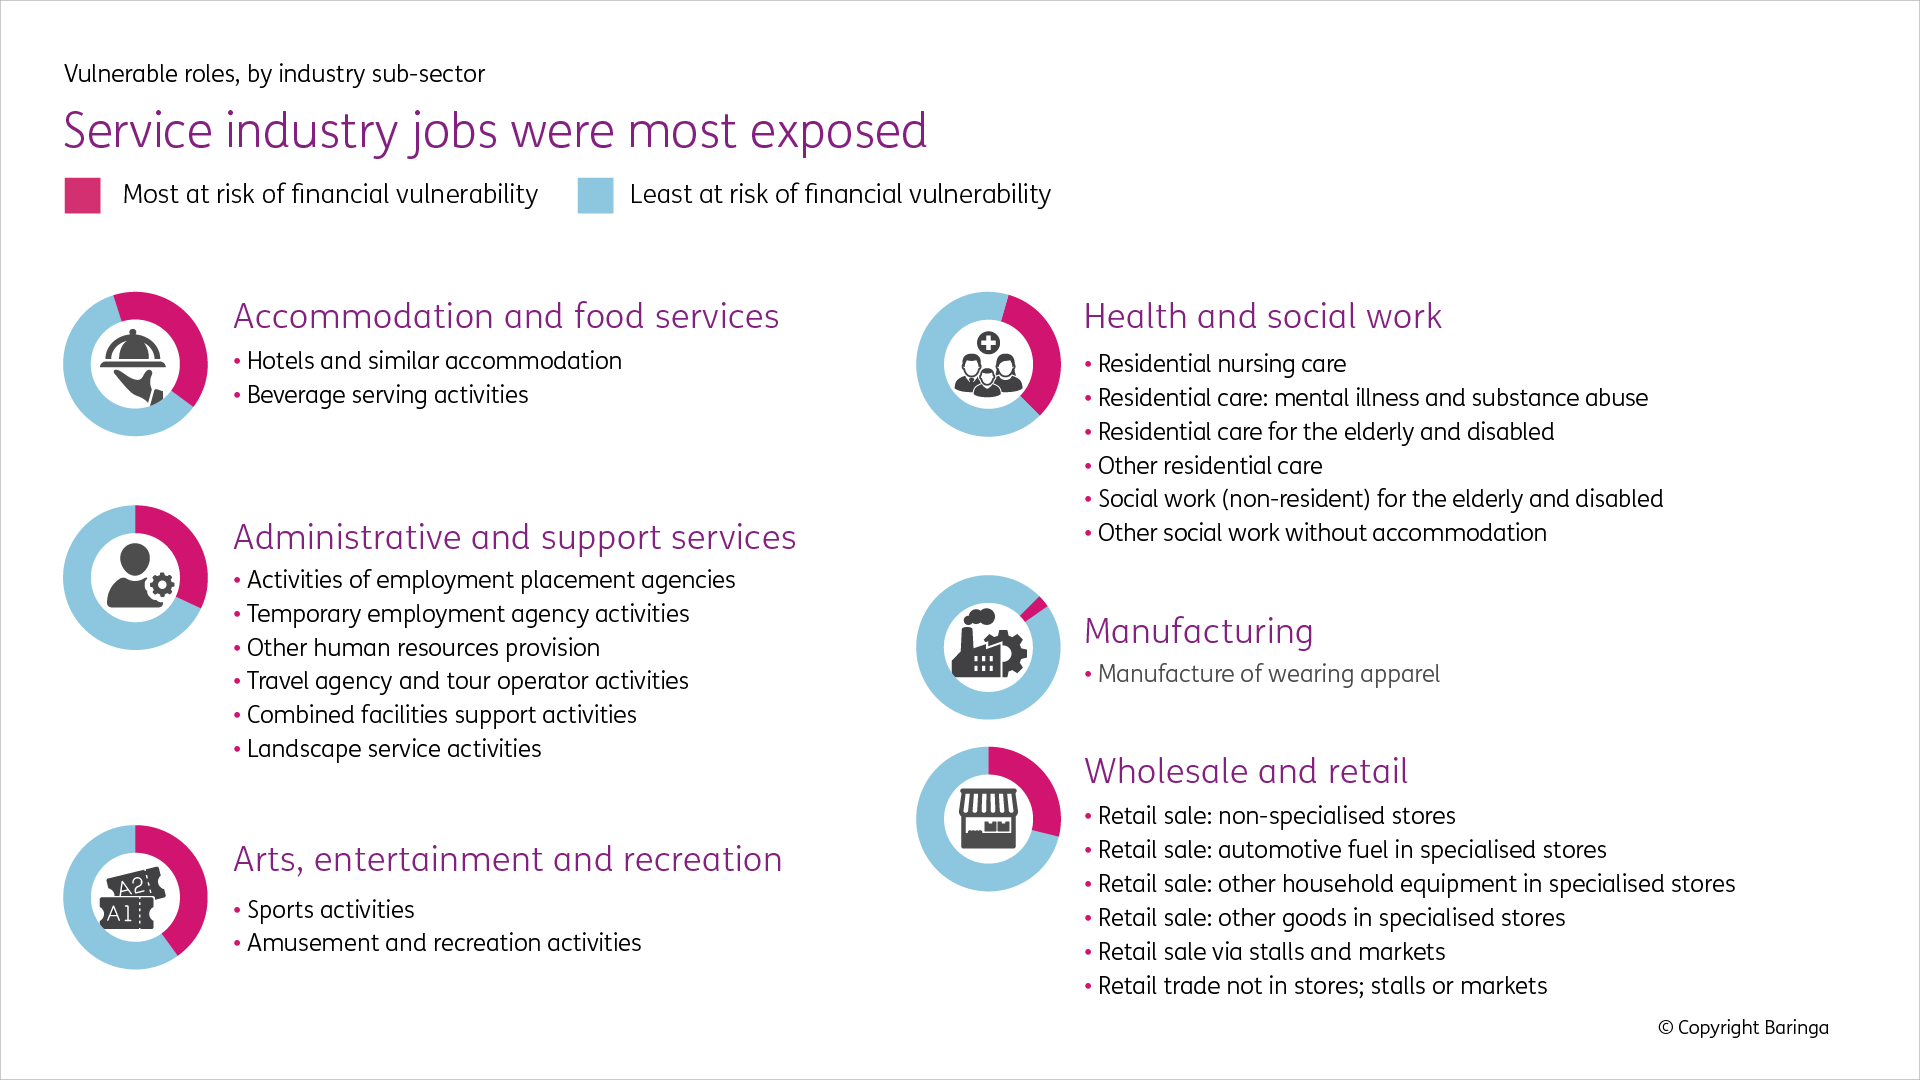
The UK’s service sector workers are increasingly at risk of becoming vulnerable
Workers most at risk of becoming vulnerable are most likely to be in three sectors:
- Health and social work
- Arts, entertainment and recreation
- Accommodation and food services
By contrast, most manufacturing roles appear better insulated from a worsening economic outlook, with just one sub-set of the manufacturing sector in the vulnerable category.

The young and the old are most at risk of financial vulnerability
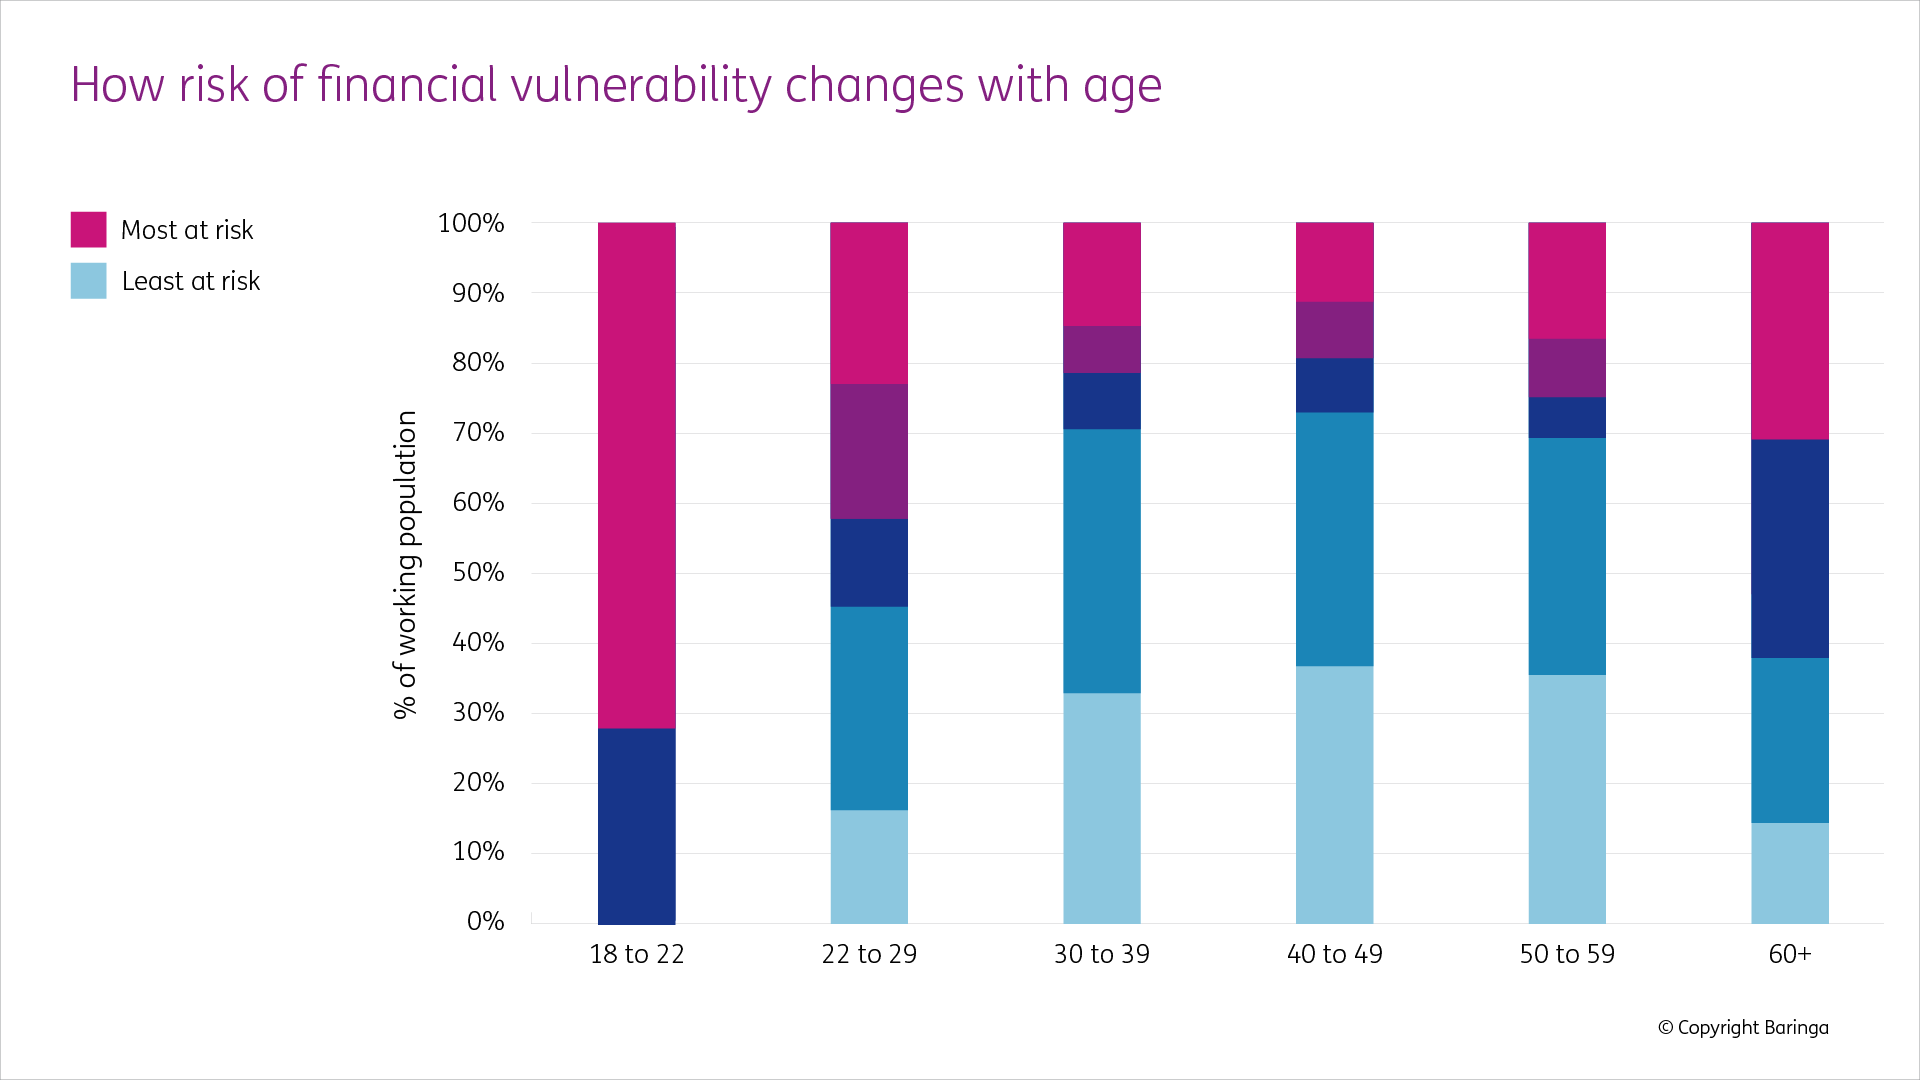
Age is an important factor in the likelihood of financial vulnerability emerging.
Those new in the workforce are more likely to be vulnerable, and the Index shows that 18–22-year-olds are three times more likely to have become more vulnerable than average since 2020. A similar proportion of over 60s have also seen the highest level of increase in vulnerability indicators.

Women’s financial vulnerability risk increases in middle age
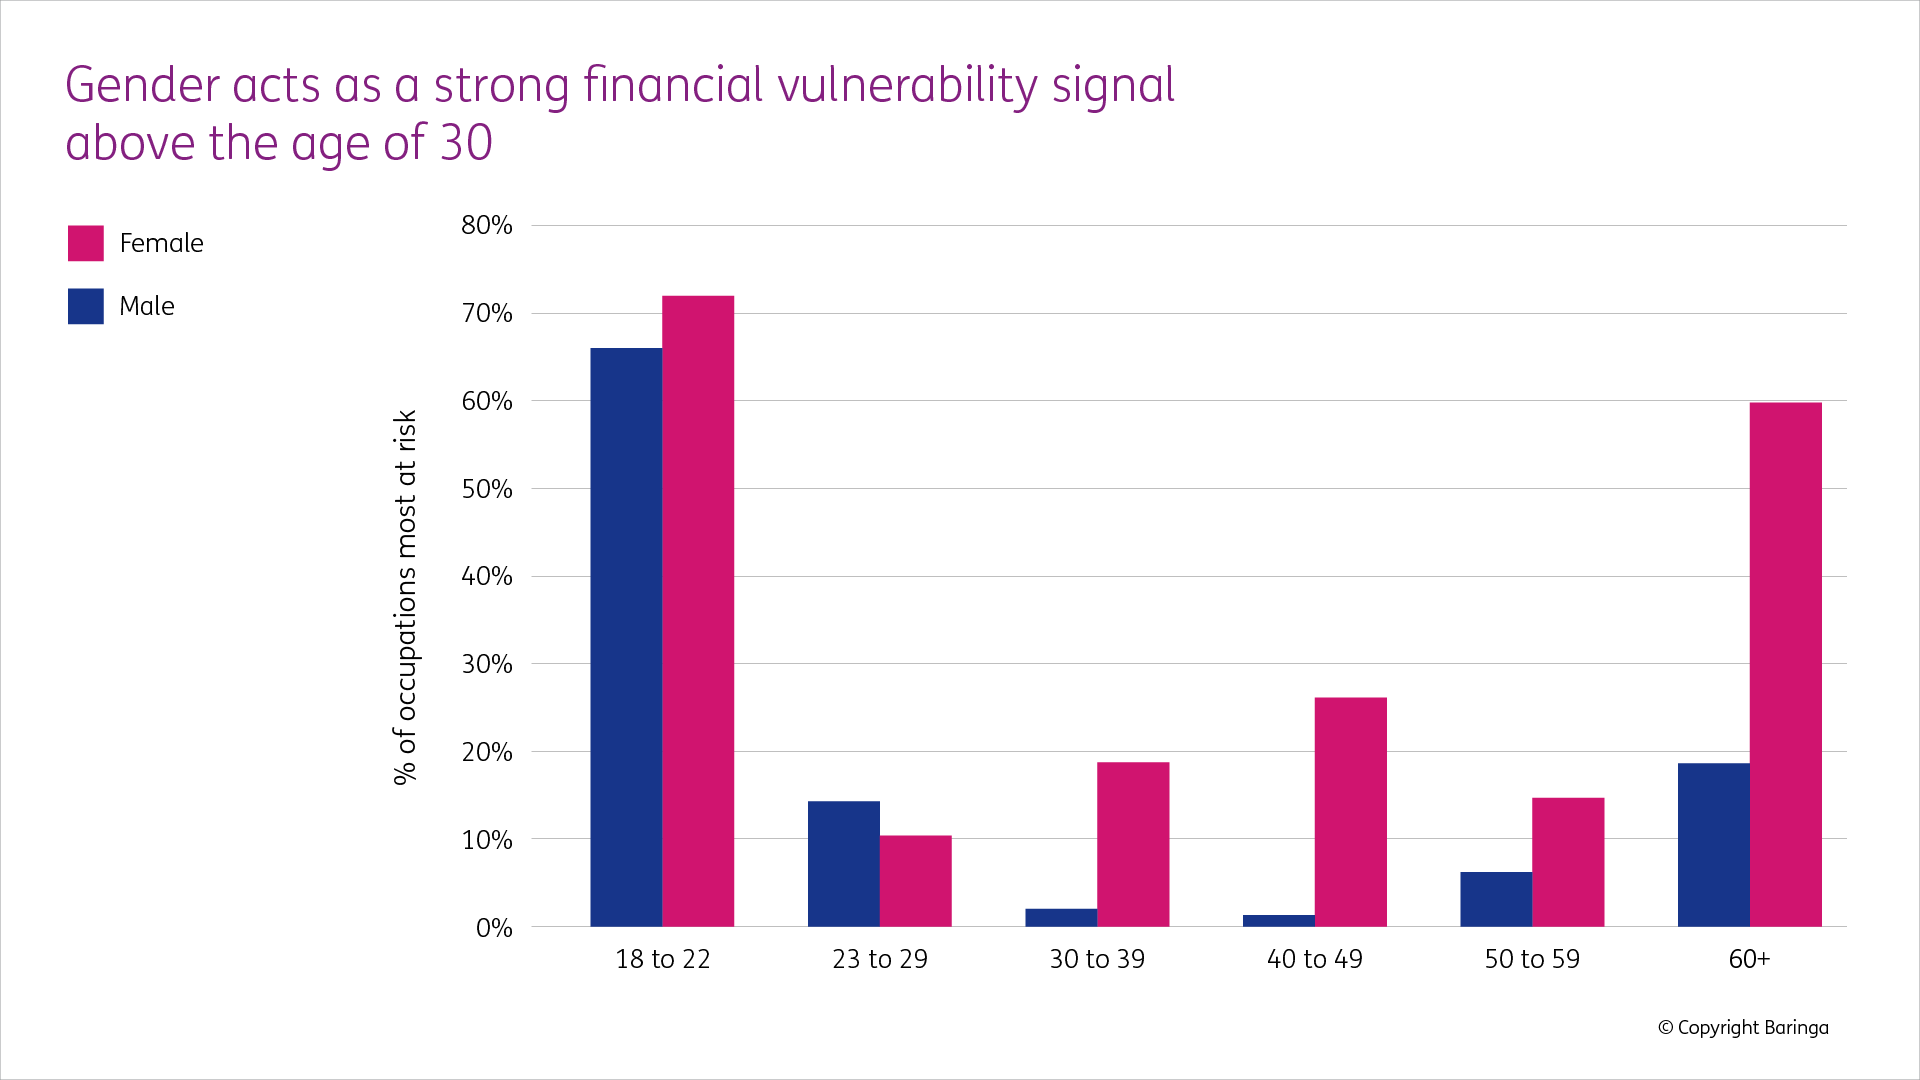
The probability of newly emerging vulnerability is broadly equal in earlier age groups before women demonstrate a heightened risk during their 30s and 40s. This is reduced in their 50s before widening significantly again in their 60s.

Who might be financially vulnerable?
Of those in work, according to the Index, the demographics that are at the greatest risk of newly emerging vulnerability are women working in arts/entertainment/social work in their 30s and 40s in the south. This does not necessarily mean people with this profile are more vulnerable than others, but that their financial resilience is likely to be deteriorating.
- Vulnerable persona #1:
50-year-old woman, social worker, in London - Vulnerable persona #2:
Young man on a flexible working contract in consumer retail. - Vulnerable persona #3:
30-year old woman, working in hospitality, in London.
Find out how companies can identify vulnerability in their customer base and support their business and their customers in navigating the changing economic context, read the third article in our series on Financial Vulnerability.
Get in touch with our experts
Caspian Conran, Political economicsRelated Insights

Navigating financial vulnerability across the UK
We explore the underlying causes of financial vulnerability and examine the outlook for winter 2025.
Read more
Britain’s poorest face doubling of debt to energy suppliers
According to Baringa's figures, Britain’s poorest people now owe twice as much to energy suppliers as they did during the 2022 energy crisis.
Read more
Taking a person-centred approach to managing financial vulnerability
As Australia starts to feel the impact of rising energy bills, we share our view.
Read more
Safeguarding Financial Vulnerability
Growing numbers of customers, and businesses, are more financially vulnerable than ever.
Read moreIs digital and AI delivering what your business needs?
Digital and AI can solve your toughest challenges and elevate your business performance. But success isn’t always straightforward. Where can you unlock opportunity? And what does it take to set the foundation for lasting success?