Interpreting carbon pricing will help you understand the transition to low carbon
29 March 2022
Over the last few weeks, carbon markets have experienced increased volatility following Russia’s invasion on Ukraine. The connection between Russia and Ukraine through gas supply and transportation links has influenced fluctuations in both energy and carbon pricing, causing a decoupling of the two: Carbon prices sank, while oil prices soared. This was also seen in reverse after COP26, where carbon prices climbed, and oil prices dropped (figure 1). What does the Futures market tell us about carbon pricing?
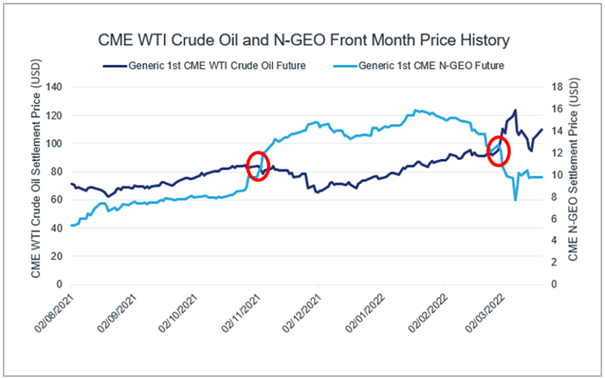
Figure 1: Historical price evolution of CME WTI crude oil future versus CME N-GEO voluntary carbon future (Front Month)
Source: CME Group
Can carbon prices be an indicator of how the market views the energy transition?
The path to net zero is affected by multiple factors, such as national climate commitments, energy pricing policy and global geopolitics. These complex dynamics translate into uncertainty for long-term carbon prices - with uncertainty comes risk.
Carbon pricing is based on the market’s “best guess” of the future implications of delivering against national targets. National targets have credibility and durability risk because there is a long lead time required to implement the policy. These risks are incorporated into the carbon pricing resulting on them being consistently under-valued and under-priced.
| Understanding Credibility and Durability Risk | |
| Credibility risk: | A measure of policy maturity. How developed is domestic decarbonisation policy in relation to Net Zero? Are rhetorical commitments backed up with substantial policy? |
| Durability risk: | A measure of the depth and breadth of political support. How vulnerable is the energy transition to political and economic shocks? |
Though, if prices are up, this implies that market players believe that national climate commitments will be met.
During COP26, major coal consumers, such as India and China, committed to “phase down” their reliance on coal. Carbon markets reacted to this, with the price of traded carbon spiking, national commitments strengthening, and Credibility & Durability risk reducing for market participants.
However, the events in Ukraine caused further uncertainty, not only over European energy policy, but of the trajectory of the energy transition itself, pushing down carbon prices (figure 2).
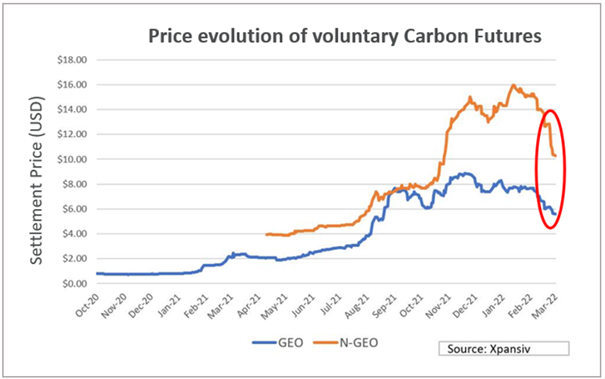
Figure 2: Historical price evolution of voluntary carbon futures
Source: Xpansiv
Uncertainty has led to a price increase in energy, while carbon prices dropped
Despite moments of historical political tension throughout the Cold War, there was a perceived stability in gas supplies because of the co-dependence between European consumers and Russian suppliers: The monopoly supply was balanced by the monopsony nature of consumption.
During 2021, the supply of Russian gas that was sent to Europe via Ukrainian transit routes was down by c.20-30%, from 2019 levels. This created a sense of supply uncertainty, contributing to elevated gas prices in the futures market.
The recent invasion in Ukraine has forced a broadly united response across the globe. Countries who are less dependent on Russian oil and gas imports, such as the US, have now committed to curtail the purchase of its oil and gas. By contrast, Germany, with a greater dependence on this, will need to move at a slower pace. As a result, we can expect that carbon emissions would rise - particularly if reliance on coal increases.
This new uncertainty over the short-term demand for both oil and gas, will impact both the path and pace achieving net zero. Consequently, this will increase the Credibility Risk facing the energy transition and will act as a discount on the carbon price.
An increase in carbon pricing expected in the carbon futures markets, regardless of the price today
The first futures markets for voluntary carbon emerged in early 2021, partly due to participants hedging their carbon exposures or locking in forward prices.
The daily settlement prices, published by the CME (see figure 2), allows to construct a transparent carbon future forward curve for the first time ever (see figure 5). This curve is critical in providing an independent valuation of the direction of future prices.
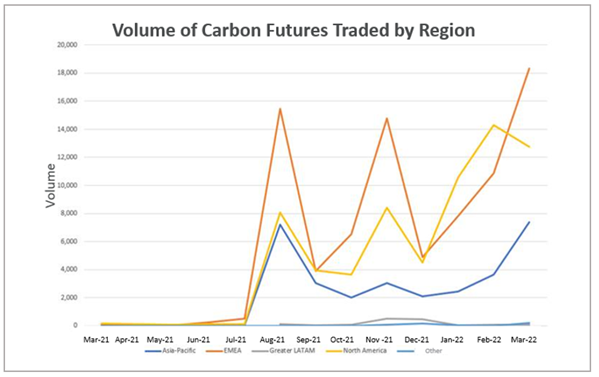
Figure 3: Absolute volume of carbon futures contracts1 traded by geography
Source: CME Group
Interestingly, there is a recent rise in participation in the futures market from the US (figure 3). This is largely because of the heightened focus on environmental issues. This has increased credibility of the Biden administration by market participants, with many new “first-time” players globally trading every month (figure 4).
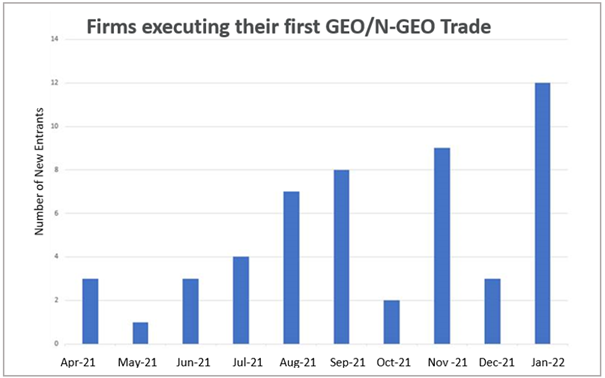
Figure 4: Number of firms executing a carbon future for the first time
Source: CME Group
The CME carbon futures have been firmly in a contango2 structure since launch. This is despite the fluctuating nature of outright prices, indicating that the market believes that future carbon prices are likely to surge as greater emphasis is put on environmental issues. Although there has been some initial flattening of the curve due to increased volatility in February 2022, the March future forwards is still upward sloping, with the whole curve shifting downwards in parallel, reflecting lower absolute levels (figure 5).
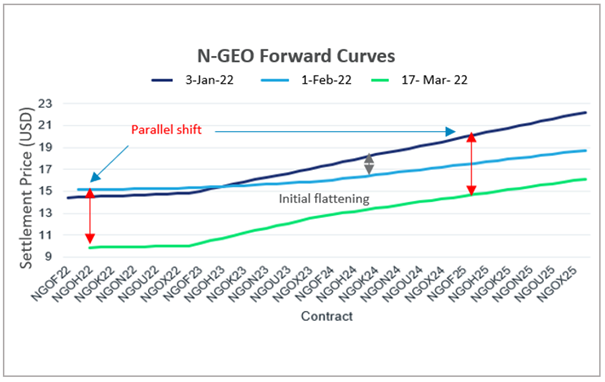
Figure 5: N-GEO forward curves over January, February and March 2022
Source: CME Group
The expansion of carbon futures supports the transition to a low carbon economy
The carbon market is becoming an effective and efficient voluntary carbon credit market. The increase in market participants and volume of carbon being traded creates more liquidity and pricing transparency.
The expansion of this market, together with the development of innovative products, such as the CME futures3, is allowing participants to address their bespoke needs to transition into the low carbon economy. In particular, the voluntary nature of carbon futures has provided stability to carbon products, reinforcing the role that derivatives can play to increase transparency and confidence when pricing carbon.
We believe that carbon markets are here to stay. Understanding them, will help participants steer capital and mitigate risks on the journey to the low carbon economy.
In developing this view of the carbon market, Baringa worked in association with CME, and we are grateful for the collaboration and input from Owain Johnson, Managing Director and Global Head of Research & Product Development at CME Group, as well as Caspian Conran, Baringa's political economist.
Footnotes:
1 One unit represents 1000 environmental offsets. Each offset is equal to one metric ton of carbon removed or reduced from the atmosphere
2 Contango: market condition where the futures price (or forward price) of a commodity is higher than the current spot price
3 CBL Core Global Emissions Offset Futures
| CME Voluntary Carbon Future Product Suite: GEO, N-GEO and C-GEO | |
| General Emissions Offset (GEO) futures (March 2021) | Based on carbon offsets accredited by Verra, ACR and CAR |
| Nature-Based General Emissions Offset (N-GEO) futures (August 2021) | Verra only eligible voluntary offsets from Agriculture, Forestry and Other Land Use (AFOLU) |
| Core General Emissions Offset (C-GEO) futures (March 2022) | Designed to reflect the general principles established by the Taskforce on Scaling Voluntary Carbon Markets. |
Related Insights

Future-proofing climate disclosures: Leveraging climate reporting for nature
Forward-thinking companies are integrating climate and nature into their strategies to drive innovation and resilience.
Read more
Transition planning in turbulent times: How financial institutions can adapt and lead
The shift to a low-carbon economy is challenging for financial institutions; we explore how they can adapt and lead in today's tough landscape.
Read more
Simplification Omnibus: what you need to know and where to go from here
We share what the Simplification Omnibus means for CSRD, CS3D and the EU Taxonomy and how you should respond.
Read more
2025 Outlook: What lies ahead for climate and sustainability in financial services?
Here's what's front of our minds for 2025 based on our dialogue with, and work for, climate and sustainability leaders across financial institutions.
Read moreIs digital and AI delivering what your business needs?
Digital and AI can solve your toughest challenges and elevate your business performance. But success isn’t always straightforward. Where can you unlock opportunity? And what does it take to set the foundation for lasting success?